Monitor Database Health
Learn how to monitor your database's health and resource utilization on KloudBean. Keeping an eye on resource utilization is crucial to avoid resource congestion issues or production downtime.
Overview
KloudBean provides a user-friendly UI to view your database health and utilization of resources. It is important to keep an eye on resource utilization in order to avoid any resource congestion issues or production downtime. Regular monitoring helps you identify potential issues before they impact your database performance and allows you to make informed decisions about scaling and optimization.
KloudBean's Optimized Database Infrastructure
KloudBean provides databases that are already best optimized, and you are having high-performance hardware. Complete database stack components along with kernel parameters are optimized and tuned to give the best performance. However, each resource still has its limitations. If you are seeing resource consumption at a critical level, then ask KloudBean to scale up. If you see resources in a warning state, then consider optimizing your database queries or plan to do some optimization, or plan to scale up in the near future.
Types of Monitoring
KloudBean provides two types of monitoring:
1. Database Health Status Page
Navigate to database administration → "Database Health" or "Health" to view real-time database health metrics and resource utilization. This provides a comprehensive visual dashboard of all critical database components.
2. Email Alerts
KloudBean sends email alerts when the database reaches critical limits. These alerts are automatically sent to your registered email address, ensuring you're immediately notified of any critical resource issues.
Accessing Database Health Monitoring
Step 1: Navigate to Database Health
To view your database health:
- Log in to your KloudBean dashboard
- Navigate to Database Administration: Open the database administration page for your desired database
- Go to "Database Health" or "Health": Click on "Database Health" or "Health" in the database settings menu
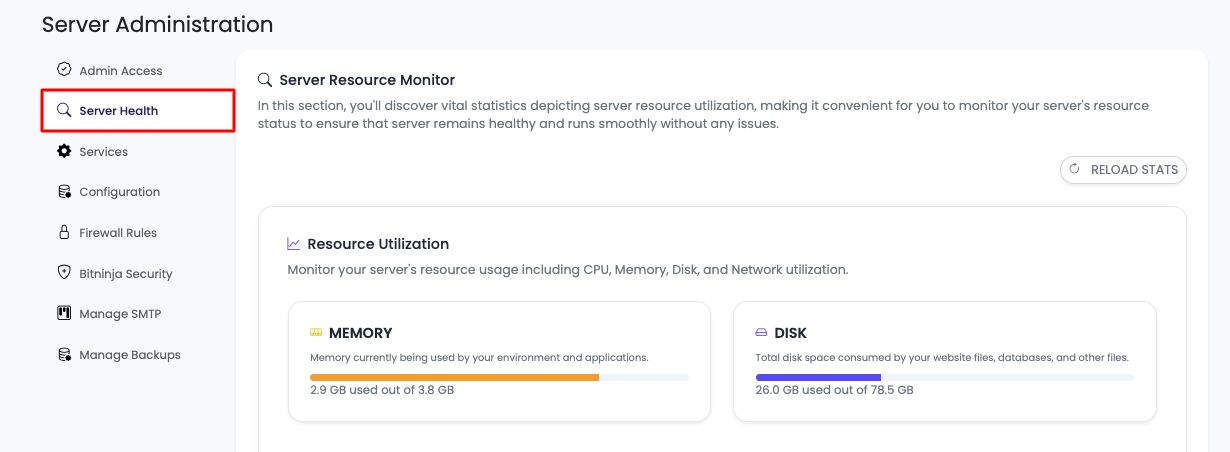
Step 2: View Complete Database Health Overview
This section provides utilization stats for all critical components. Here is the complete view of database health:
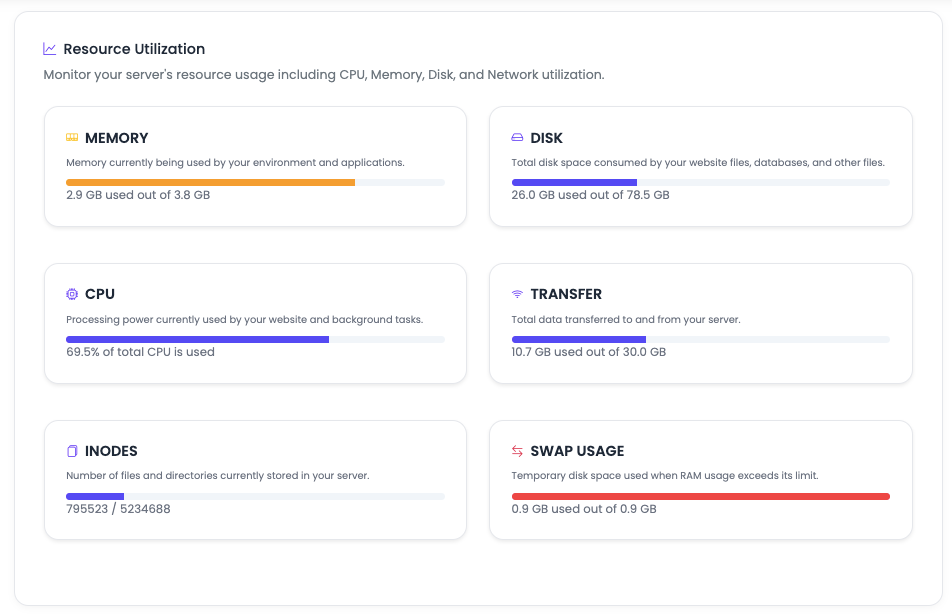
Monitored Resources
KloudBean monitors all these resources and displays their utilization:
- MEMORY: RAM usage and availability
- DISK: Storage space and disk I/O
- CPU: Processor utilization and load
- DATA TRANSFERRED: Network bandwidth usage
- INODES: File system inode usage
- SWAP MEMORY: Virtual memory usage
Understanding Color Indicators
KloudBean uses color coding to quickly indicate resource status:
- Blue: Resources are in good condition, not much used. This indicates healthy resource levels with plenty of capacity available.
- Yellow: Warning state. Resources are approaching their limits, and you should monitor closely or consider optimization or scaling.
- Red: Critical condition. Resources are at or near their maximum capacity, and immediate action is required to prevent database service disruption.
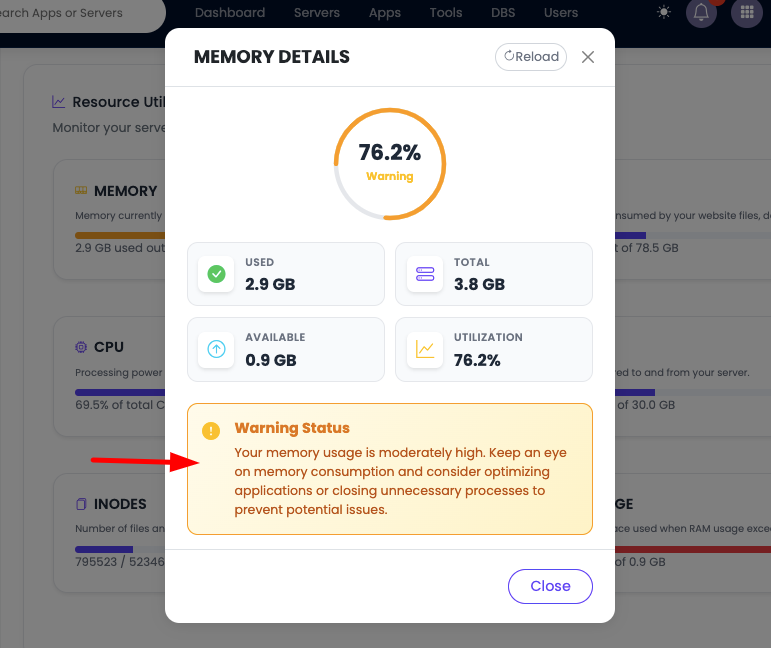
Viewing Detailed Resource Information
To view more detailed information about a particular resource:
- Click on the Resource: Click on the specific resource card or section you want to examine
- View Detailed Metrics: You'll see expanded information.
Understanding Each Resource
Memory (RAM)
What It Is: Random Access Memory (RAM) is the primary storage for active database data, query results, and running database processes. It's much faster than disk storage and is used by the database engine to store frequently accessed data, indexes, and query caches.
Why Monitor Memory for Databases:
- Query Performance: Insufficient memory causes slow query execution and poor database performance
- Database Stability: Low memory can cause database crashes and connection failures
- Cache Efficiency: Database caches (like InnoDB buffer pool, PostgreSQL shared buffers) need adequate RAM
- Connection Handling: Each database connection consumes memory
- Memory Leaks: Monitoring helps identify database processes with memory leaks
- Capacity Planning: Understanding memory usage helps plan for future database scaling
What to Watch For:
- Memory usage consistently above 80% indicates you may need more RAM
- Rapid memory growth may indicate a memory leak in database processes
- High swap usage means your database is running out of physical RAM
- Memory spikes during peak query times or high connection counts
Recommendation: If you observe high memory utilization consistently, contact KloudBean to scale up your database's RAM. For warning levels, consider optimizing your database queries, reducing connection pool sizes, or adjusting database cache settings before planning for scaling in the near future.
Disk Storage
What It Is: Disk storage is where all your database files, data files, indexes, transaction logs, and backups are permanently stored. Unlike RAM, disk storage persists even when the database is stopped.
Why Monitor Disk for Databases:
- Storage Capacity: Running out of disk space can cause database write failures and data loss
- Performance: Full disks significantly slow down database read/write operations
- Database Growth: Databases continuously grow and need adequate disk space
- Transaction Logs: Database transaction logs can consume significant disk space
- Backup Space: Database backups require substantial disk space
- Index Storage: Database indexes consume additional disk space
What to Watch For:
- Disk usage above 80% requires immediate attention for databases
- Rapid disk space consumption may indicate transaction log growth or data accumulation
- Low disk space can prevent database operations like INSERT, UPDATE, and index creation
- Disk I/O performance degradation as disk fills up affects query performance
- Database backup failures due to insufficient disk space
Recommendation: If disk utilization reaches critical levels, contact KloudBean to scale up your database storage. For warning states, consider cleaning up old transaction logs, archiving old data, optimizing database tables, or planning for storage expansion.
CPU (Central Processing Unit)
What It Is: The CPU is the brain of your database server, executing database queries, processing transactions, and handling all database operations.
Why Monitor CPU for Databases:
- Query Performance: High CPU usage slows down all database queries and operations
- Response Times: CPU bottlenecks cause slow response times for database queries
- Concurrent Queries: CPU capacity determines how many queries can be processed simultaneously
- Query Optimization: Understanding CPU usage helps identify slow or inefficient queries
- Scaling Decisions: CPU metrics help determine when to scale up database resources
What to Watch For:
- Sustained CPU usage above 95% indicates you need more processing power
- CPU spikes during specific queries may indicate optimization opportunities
- High CPU load averages suggest the database is overloaded with queries
- CPU wait times indicate I/O bottlenecks (disk or network)
- CPU-intensive operations like complex joins, aggregations, or full table scans
Recommendation: If CPU utilization consistently reaches critical levels, contact KloudBean to scale up your database's CPU resources. For warning states, consider optimizing your database queries, adding proper indexes, implementing query caching, or reviewing query execution plans before scaling.
Data Transferred (Network Bandwidth)
What It Is: Data transferred represents the amount of network traffic (incoming and outgoing) your database handles. This includes database queries, query results, replication traffic, backup transfers, and client connections.
Why Monitor Data Transfer for Databases:
- Bandwidth Limits: Exceeding bandwidth limits can result in additional charges or throttling
- Query Performance: High network usage can slow down database query responses
- Replication Traffic: Database replication consumes network bandwidth
- Backup Transfers: Database backups generate significant network traffic
- Connection Overhead: Each database connection uses network bandwidth
- Cost Management: Monitoring helps control bandwidth costs
What to Watch For:
- Sudden spikes in data transfer may indicate traffic anomalies or DDoS attacks
- Consistently high transfer rates may require bandwidth upgrades
- Incoming vs outgoing traffic patterns (queries vs results)
- Peak usage times and trends
- Replication traffic between database nodes
Recommendation: If data transfer consistently reaches limits, contact KloudBean to upgrade your bandwidth plan. Monitor traffic patterns to identify optimization opportunities like query result caching, reducing unnecessary data transfers, or optimizing replication settings.
Inodes
What It Is: Inodes are data structures that store information about files and directories on your file system. Each file, directory, or symbolic link uses one inode. Databases create many files for data, indexes, logs, and temporary operations.
Why Monitor Inodes for Databases:
- File System Limits: Running out of inodes prevents creating new database files, even if disk space is available
- Database Operations: Low inodes can prevent database operations like creating new tables or indexes
- Log Files: Database log files consume inodes
- Temporary Files: Database temporary files and operations use inodes
- System Operations: Low inodes can prevent system updates and database maintenance operations
- Application Failures: Applications may fail if the database cannot create new files
What to Watch For:
- Inode usage above 80% requires attention
- Rapid inode consumption may indicate an application or database creating too many files
- Many small database files (like individual table files, log files) consume inodes quickly
- Inode exhaustion can occur even with plenty of disk space available
- Database operations failing due to inode limits
Recommendation: If inode usage reaches critical levels, contact KloudBean for assistance. Consider cleaning up unnecessary database files, optimizing file creation patterns, archiving old log files, or planning for inode capacity increases.
Swap Memory
What It Is: Swap memory is disk space used as virtual memory when physical RAM is full. The system moves less-used data from RAM to swap to free up RAM for active database processes.
Why Monitor Swap for Databases:
- Performance Indicator: High swap usage indicates insufficient RAM for database operations
- Performance Degradation: Using swap is much slower than RAM, causing significant database performance issues
- Query Slowdown: Database queries become very slow when swap is heavily used
- System Health: Excessive swap usage can indicate memory pressure on database processes
- Disk I/O Impact: Swap usage increases disk I/O, affecting overall database performance
What to Watch For:
- Any significant swap usage suggests your database needs more RAM
- High swap activity (swapping in/out) indicates memory pressure
- Swap usage combined with high memory usage confirms RAM shortage
- Database performance degradation correlates with swap usage
- Slow query execution when swap is active
Recommendation: If swap memory is being used consistently, contact KloudBean to increase your database's RAM. Swap usage is a clear indicator that your database needs more memory resources. Database performance is severely impacted when swap is used.
Database-Specific Metrics
In addition to resource monitoring, KloudBean also tracks database-specific metrics:
Connection Metrics
- Active Connections: Current number of active database connections
- Connection Limit: Maximum allowed connections
- Connection Pool: Connection pool utilization
- Connection Errors: Failed connection attempts
- Connection Wait Time: Time waiting for available connections
Query Performance Metrics
- Average Query Time: Average query execution time
- Slow Queries: Queries taking longer than threshold
- Query Count: Number of queries per second
- Slow Query Log: List of slow-running queries
- Query Cache Hit Rate: Percentage of queries served from cache
Transaction Metrics
- Transactions per Second: Transaction rate
- Transaction Duration: Average transaction time
- Lock Wait Time: Time waiting for database locks
- Deadlocks: Deadlock occurrences
- Rollback Rate: Percentage of rolled-back transactions
Database-Specific Metrics by Type
MySQL/MariaDB Metrics
- InnoDB Buffer Pool: Buffer pool usage and hit rate
- Table Locks: Lock wait times and lock contention
- Replication Lag: Replication delay (if applicable)
- Binary Log: Binary log status and size
- Thread Cache: Thread cache hit rate
PostgreSQL Metrics
- Connection Pool: Connection pool statistics
- Cache Hit Ratio: Cache effectiveness (shared buffers)
- Vacuum Status: Vacuum operations and bloat
- Replication Status: Replication health (if applicable)
- Checkpoint Activity: Checkpoint frequency and duration
MongoDB Metrics
- Oplog: Oplog status and size
- Index Usage: Index effectiveness and usage
- Replication Lag: Replication delay between nodes
- Sharding Status: Shard health (if applicable)
- Collection Stats: Collection size and document counts
Redis Metrics
- Memory Usage: Redis memory consumption
- Key Count: Number of keys in database
- Hit Rate: Cache hit rate percentage
- Commands per Second: Command execution rate
- Connected Clients: Number of connected clients
Elasticsearch Metrics
- Cluster Health: Overall cluster health status
- Index Count: Number of indices
- Document Count: Total documents indexed
- Search Rate: Searches per second
- Indexing Rate: Documents indexed per second
Monitoring Via Email Alerts
KloudBean sends alerts if any resource utilization crosses the limit. Alerts are sent automatically to your registered email address.
Alert Thresholds
By default, these thresholds are set to trigger email alerts:
- CPU_THRESHOLD=95%: Alert when CPU usage exceeds 95%
- MEM_THRESHOLD=85%: Alert when memory usage exceeds 85%
- DISK_THRESHOLD=80%: Alert when disk usage exceeds 80%
How Email Alerts Work
- Automatic Monitoring: KloudBean continuously monitors all database resources
- Threshold Detection: When a resource exceeds its threshold, an alert is triggered
- Email Notification: An email is automatically sent to your registered email address
- Alert Details: The email includes:
- Which resource exceeded the threshold
- Current utilization percentage
- Recommended actions
- Database information
Responding to Alerts
Critical Alerts (Red):
- Immediate Action: Contact KloudBean support to scale up database resources
- Investigation: Check what's causing the high utilization (queries, connections, etc.)
- Temporary Measures: Consider temporarily stopping non-essential database operations
Warning Alerts (Yellow):
- Monitor Closely: Keep an eye on the resource usage
- Optimization: Consider optimizing your database queries and indexes
- Planning: Plan for database scaling in the near future
- Preventive Action: Take action before it becomes critical
Best Practices for Database Health Monitoring
Regular Monitoring
- Daily Checks: Review database health dashboard daily
- Weekly Reviews: Analyze weekly trends and patterns
- Monthly Analysis: Review monthly reports for capacity planning
- Alert Response: Respond promptly to email alerts
- Query Analysis: Regularly review slow query logs
Proactive Management
- Address Warnings Early: Don't wait for critical alerts
- Optimize Before Scaling: Try query optimization before scaling up
- Monitor Trends: Watch for gradual increases in resource usage
- Plan Ahead: Scale database resources before reaching critical levels
- Index Maintenance: Regularly review and optimize database indexes
Optimization vs Scaling
When to Optimize:
- Resources are in warning state (yellow)
- You can identify slow queries or missing indexes
- Performance issues are query-related, not resource-related
- You want to maximize current resource efficiency
- Database queries can be optimized
When to Scale Up:
- Resources consistently reach critical levels (red)
- Optimization has been attempted but resources are still insufficient
- Database traffic or workload has genuinely increased
- You need immediate capacity increase
- Query optimization cannot resolve resource constraints
Resource Planning
- Baseline Metrics: Establish normal baseline metrics for your database
- Growth Projections: Plan for future growth based on trends
- Peak Times: Identify peak usage times and plan accordingly
- Capacity Planning: Plan scaling before resources become critical
- Query Patterns: Understand query patterns and their resource impact
Troubleshooting Database Resource Issues
High Memory Usage
- Identify Processes: Check which database processes are using the most memory
- Memory Leaks: Look for database processes with continuously growing memory usage
- Optimize Queries: Review and optimize database queries to reduce memory usage
- Connection Pool: Review and optimize connection pool settings
- Cache Settings: Adjust database cache settings (buffer pools, shared buffers)
- Scale Up: Contact KloudBean to increase RAM if optimization isn't sufficient
High CPU Usage
- Identify CPU-Intensive Queries: Find queries consuming CPU resources
- Query Optimization: Optimize database queries and add proper indexes
- Slow Query Analysis: Review slow query logs and optimize slow queries
- Caching: Implement query caching to reduce CPU load
- Connection Management: Reduce unnecessary database connections
- Scale Up: Contact KloudBean to increase CPU resources if needed
High Disk Usage
- Identify Large Tables: Find tables and indexes consuming disk space
- Clean Up: Remove unnecessary data, old logs, and temporary files
- Archive Old Data: Move old data to archival storage
- Table Optimization: Optimize database tables and indexes
- Transaction Logs: Manage transaction log sizes
- Scale Up: Contact KloudBean to increase disk storage
High Inode Usage
- Find File Sources: Identify database directories with many small files
- Clean Up: Remove unnecessary database files and log files
- Optimize File Creation: Review database operations creating too many files
- Log Management: Implement log rotation and cleanup
- Contact Support: Reach out to KloudBean for inode capacity solutions
Database Performance Issues
- Review Query Performance: Analyze slow query logs
- Check Indexes: Verify indexes are being used effectively
- Connection Issues: Review connection pool and connection limits
- Lock Contention: Check for database locks and deadlocks
- Resource Bottlenecks: Identify which resource is the bottleneck
- Optimize or Scale: Apply optimizations or scale resources as needed
KloudBean's Optimized Database Infrastructure
Pre-Optimized Databases
KloudBean provides databases that are already best optimized with:
- High-Performance Hardware: Latest generation processors and fast storage
- Optimized Database Stack: All database components are optimized for performance
- Tuned Database Parameters: Database configuration is tuned for optimal performance
- Best Practices Applied: Industry best practices implemented by default
- Proper Indexing: Default indexes and optimization strategies
Performance Benefits
- Maximum Efficiency: Get the best performance from your database resources
- Reduced Overhead: Optimized databases have lower overhead
- Better Resource Utilization: More efficient use of available resources
- Proven Configurations: Tested and proven optimal database configurations
- Fast Query Execution: Optimized for fast query processing
When Resources Still Have Limits
Despite optimization, each resource still has its limitations:
- Physical Constraints: Hardware has physical limits
- Database Growth: Databases and data grow over time
- Query Complexity: Complex queries require more resources
- Connection Limits: Database connection limits exist
- Resource Exhaustion: Even optimized databases can run out of resources
- Scaling Needs: Growth requires additional database resources
Making Scaling Decisions
If you see resource consumption at a critical level (Red):
- Immediate Action: Contact KloudBean to scale up database resources immediately
- Prevent Downtime: Scaling prevents database service disruption
- Quick Resolution: KloudBean can help scale database resources quickly
- Query Impact: Critical resources can cause query failures
If you see resources in warning state (Yellow):
- Optimize First: Consider optimizing your database queries and indexes
- Plan Optimization: Review queries for efficiency improvements
- Plan Scaling: Plan to scale up database resources in the near future
- Monitor Closely: Keep monitoring to prevent critical state
- Query Review: Review and optimize slow queries
Next Steps
After monitoring your database health:
- Learn about Controlling Database Access to manage database access
- Explore Configuring Database Backup Settings to protect your database data
- Review Launching MySQL for database options
- Check other database management guides for optimization tips