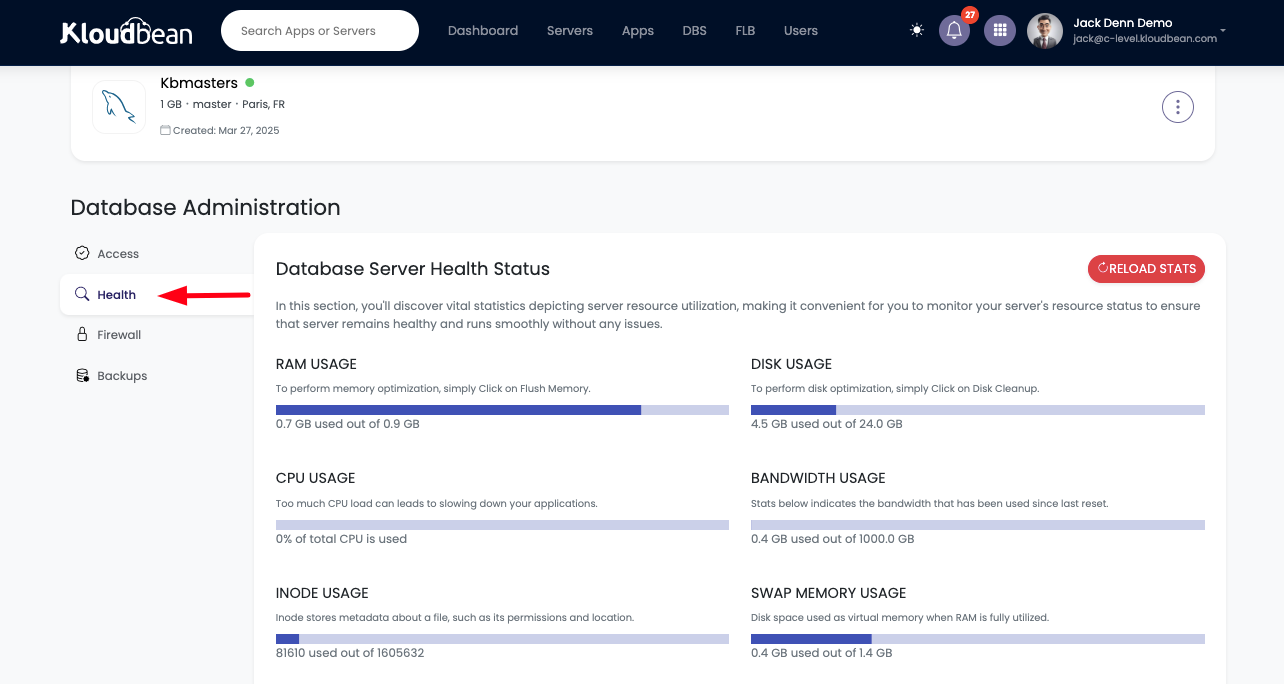
With Kloudbean’s powerful monitoring tools, you gain detailed insights into your database server’s performance by tracking various key metrics such as CPU usage, memory usage, query response times, disk utilization, swap usage, inode consumption, and bandwidth utilization. These metrics are essential for understanding the current state of your server and the health of your database operations.
Kloudbean’s Optimization Layers and Security
Kloudbean doesn’t just provide monitoring tools; we also take care of optimizing your database server at multiple layers. We ensure that the OS layer, kernel layer, and database layer are finely tuned to deliver optimal performance. Our lightweight optimizations at each level help reduce resource consumption, allowing your server to run efficiently even under heavy workloads. Additionally, Kloudbean places a strong emphasis on security, implementing best practices and configurations to keep your database safe from unauthorized access or attacks.
View Database Utilization stats.
From the dashboard click on Managed Database to go to DBS (Database System) section to view existing databases.
Clicking on your database, It should take us to databases Administration section.

At Kloudbean, we provide users with a comprehensive set of real-time monitoring tools directly from the database server dashboard. One of the key sections in the dashboard is the Health section, where users can monitor vital server utilization metrics such as RAM utilization, CPU utilization, disk usage, swap usage, inode usage, and bandwidth. These metrics give users a quick and easy way to assess the performance and health of their database server in real-time. By having immediate access to these statistics, users can stay proactive in maintaining their systems and ensure that their database runs efficiently. Let’s dive into the importance of each of these utilization metrics and how they help in monitoring and optimizing the database server's performance.
RAM Utilization
RAM (Random Access Memory) is a critical resource for database performance. When a database operates, it stores frequently accessed data in memory for quick retrieval, which significantly speeds up query performance. High RAM utilization indicates that the database is processing a large amount of data or handling a high number of queries at once. If RAM usage consistently runs at high levels, it may suggest that your server is running out of available memory, which could lead to slower performance or even crashes. On the Kloudbean platform, you can easily monitor RAM utilization, and if you notice that the system is hitting its limits, it may be time to upgrade the server’s memory or optimize the database for better performance.
CPU Utilization
CPU utilization reflects how much processing power your server is using to handle database operations. High CPU utilization can occur when there are complex queries, large data processing tasks, or a high number of simultaneous connections. If CPU usage consistently reaches high levels, it may cause system slowdowns or even failures. In database management, high CPU usage may indicate that queries need to be optimized, or the hardware may need to be upgraded. By tracking CPU utilization on Kloudbean, you can quickly identify any performance bottlenecks and take corrective actions, such as query optimization or server upgrade.
Disk Usage
Disk space is essential for storing the actual database data, logs, and backups. High disk usage may indicate that your database is growing rapidly, possibly due to increased data storage requirements or large data sets. If the disk is near full capacity, database operations may slow down, and new data may not be able to be stored. On the Kloudbean platform, you can monitor disk utilization to ensure that your storage capacity is not being overutilized. If you notice that disk usage is consistently high, it may be time to increase storage capacity or manage database files more efficiently (e.g., archiving old data or removing unnecessary files).
Swap Usage
Swap space is a part of the disk used when RAM is full, essentially acting as virtual memory. While swap is helpful for preventing crashes when memory is exhausted, it is much slower than RAM and can significantly degrade performance. If your server is consistently using swap, it means that the system is running out of physical RAM and relying on the disk to handle memory needs. In a database context, high swap usage can severely impact performance, especially for data-intensive operations. Monitoring swap usage on Kloudbean helps users identify memory bottlenecks and consider either upgrading RAM or optimizing the database’s memory usage.
Inode Usage
Inodes represent data structures on a file system that store information about files, such as their size, location, and access permissions. Every file, directory, and symbolic link on the server consumes an inode. In the context of a database server, a high inode usage could indicate that the server is creating a large number of files, such as logs, temporary files, or database files. If inode usage is running high, the server might run out of inodes, preventing the creation of new files. This could potentially cause database errors or slowdowns. Monitoring inode usage on Kloudbean allows users to ensure that their file system has enough inodes to accommodate the database’s operational needs.
Bandwidth Utilization
Bandwidth utilization measures the rate at which data is being transferred between the server and other devices or clients. In the case of a database, this can refer to the amount of data being transferred for queries, updates, and other database-related operations. If bandwidth utilization is consistently high, it may indicate that the database is handling a large volume of requests or transmitting large amounts of data. In some cases, high bandwidth usage can affect performance and user experience. By monitoring bandwidth usage in real-time through Kloudbean, users can identify potential network bottlenecks and ensure smooth database operations.

When to Upgrade?
If, despite all optimizations, a user sees that their server utilization is consistently high across any of these metrics (RAM, CPU, disk, swap, inode, bandwidth), it may indicate that the server resources are no longer sufficient for their workload. This is when an upgrade becomes necessary. Upgrading to a higher-tier instance with more resources can help ensure that your database continues to run smoothly, with optimal performance and minimal downtime.
Kloudbean Support
In case users encounter issues or need assistance with monitoring or upgrading their database server, Kloudbean’s expert support team is always available to help. Our support is accessible 24/7, ensuring that any performance concerns are addressed promptly. Whether you need help interpreting utilization statistics or require assistance with an upgrade, Kloudbean’s support team is ready to assist you at every step.
Conclusion
Database health monitoring is essential for keeping your systems running smoothly. Kloudbean’s monitoring tools provide the necessary insights and alerts to help you optimize your server's performance. By staying on top of these metrics, you ensure that your database continues to operate at peak efficiency with minimal disruptions.